AEGIS
A multi-agent platform for monitoring maritime shipping risk across chokepoints, supply chains, and tariff regimes — built on top of seven live data sources, four database technologies, and a CrewAI orchestrator with W3C PROV lineage.
build aegis --releaseReady Stack resolved in 0.23s
[+] loaded dependency: FastAPI
[+] loaded dependency: React 19
[+] loaded dependency: CrewAI
[+] loaded dependency: PostGIS
[+] loaded dependency: Neo4j
[+] loaded dependency: ChromaDB
[+] loaded dependency: Redis
[+] loaded dependency: deck.gl
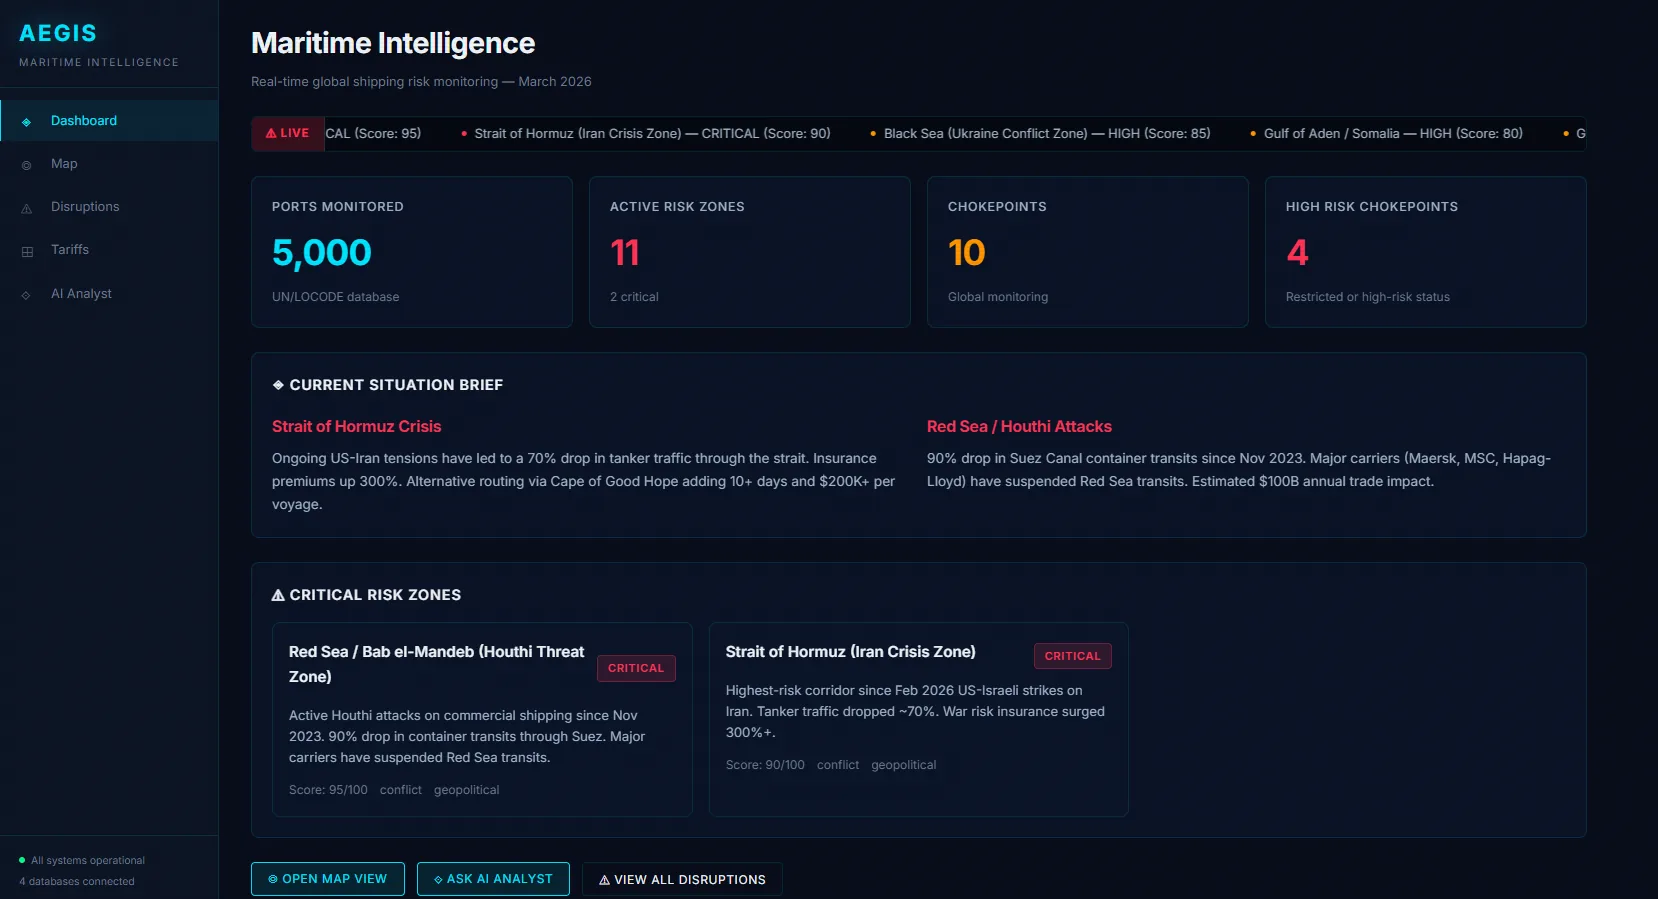
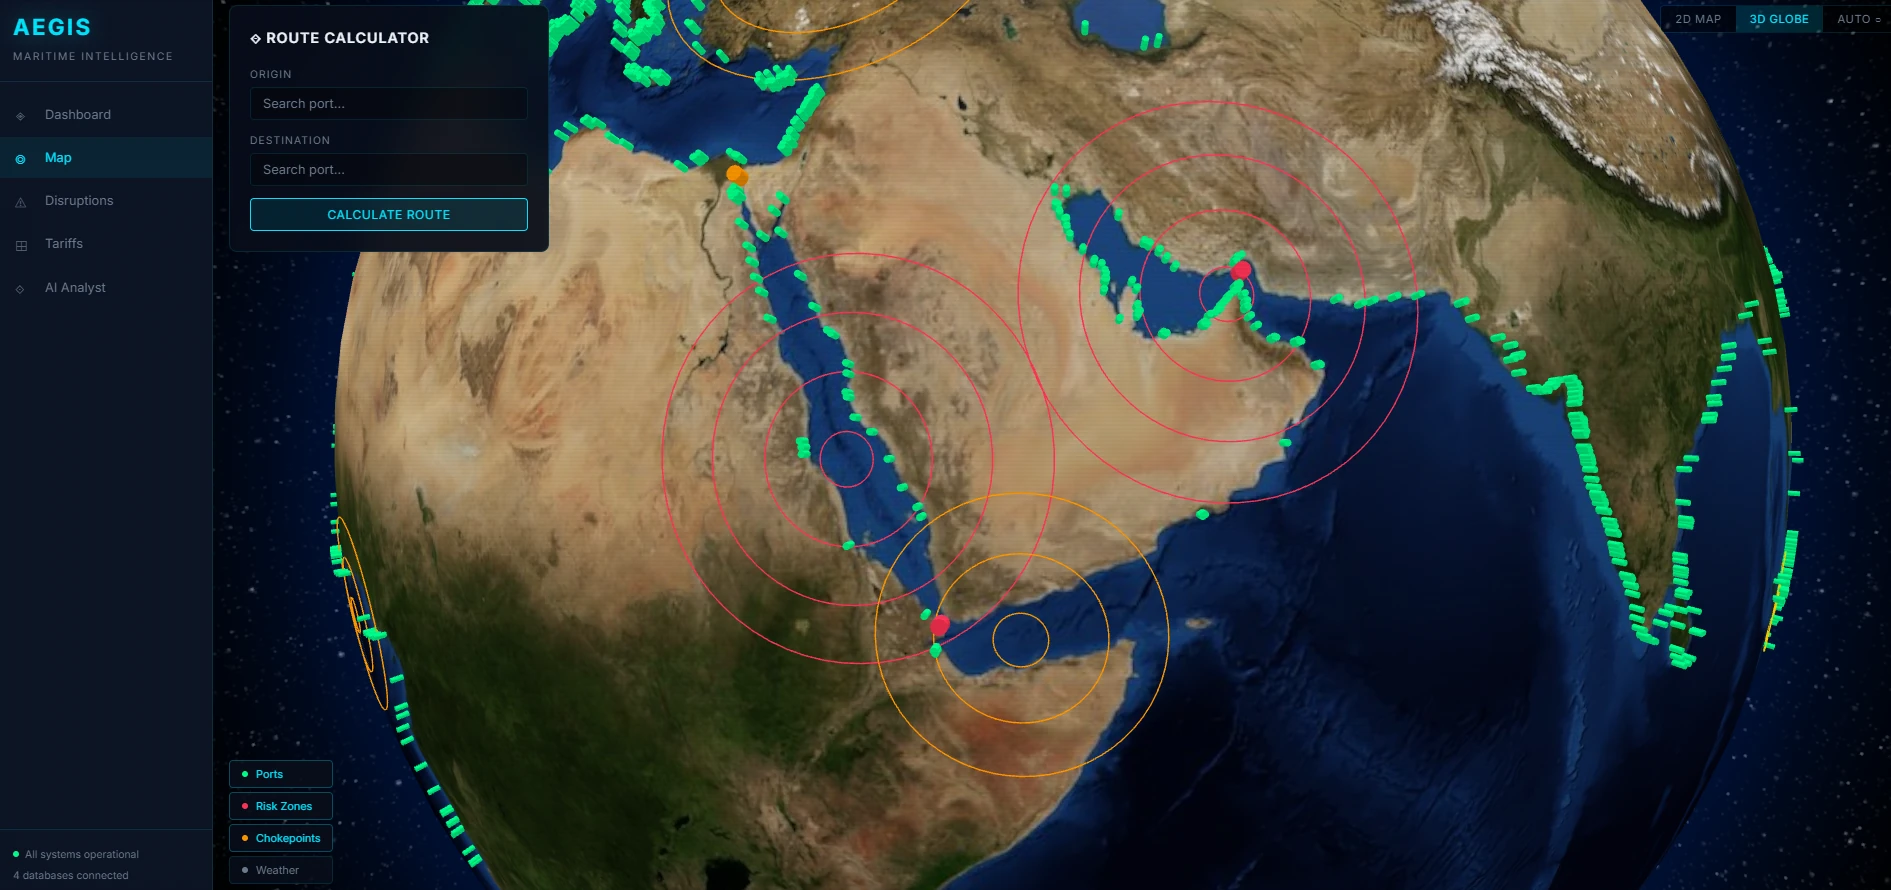
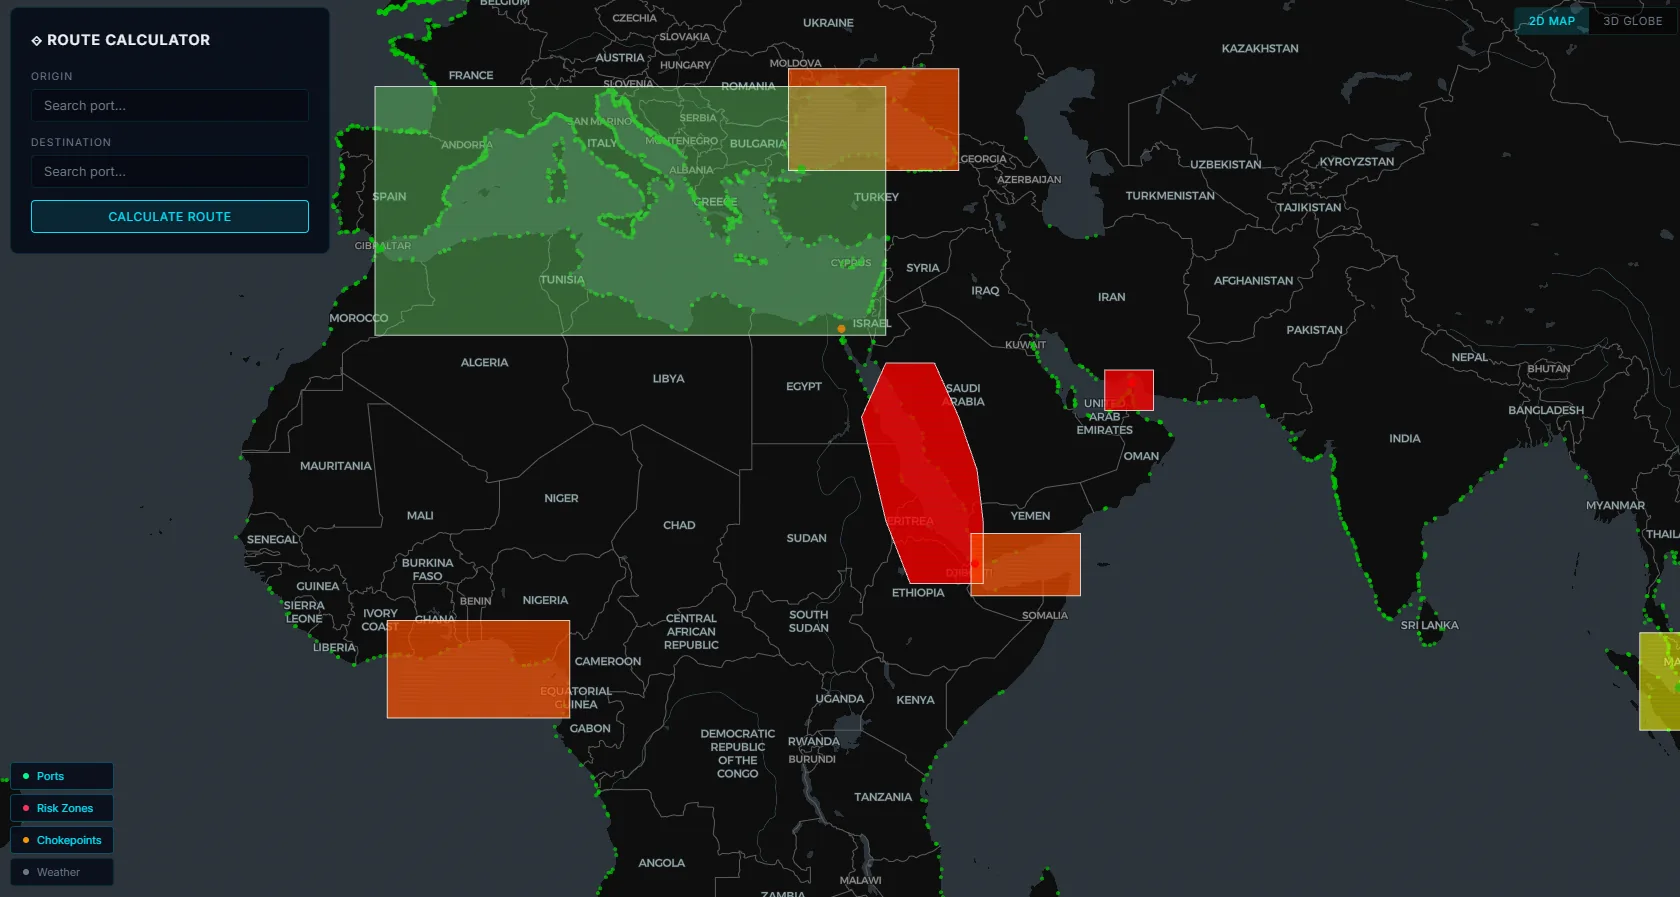
[+] loaded dependency: Docker01 / Operations views.
Three views, one mental model. The 3D globe is for situational awareness; the 2D map for incident triage; the dashboard for daily standup metrics.
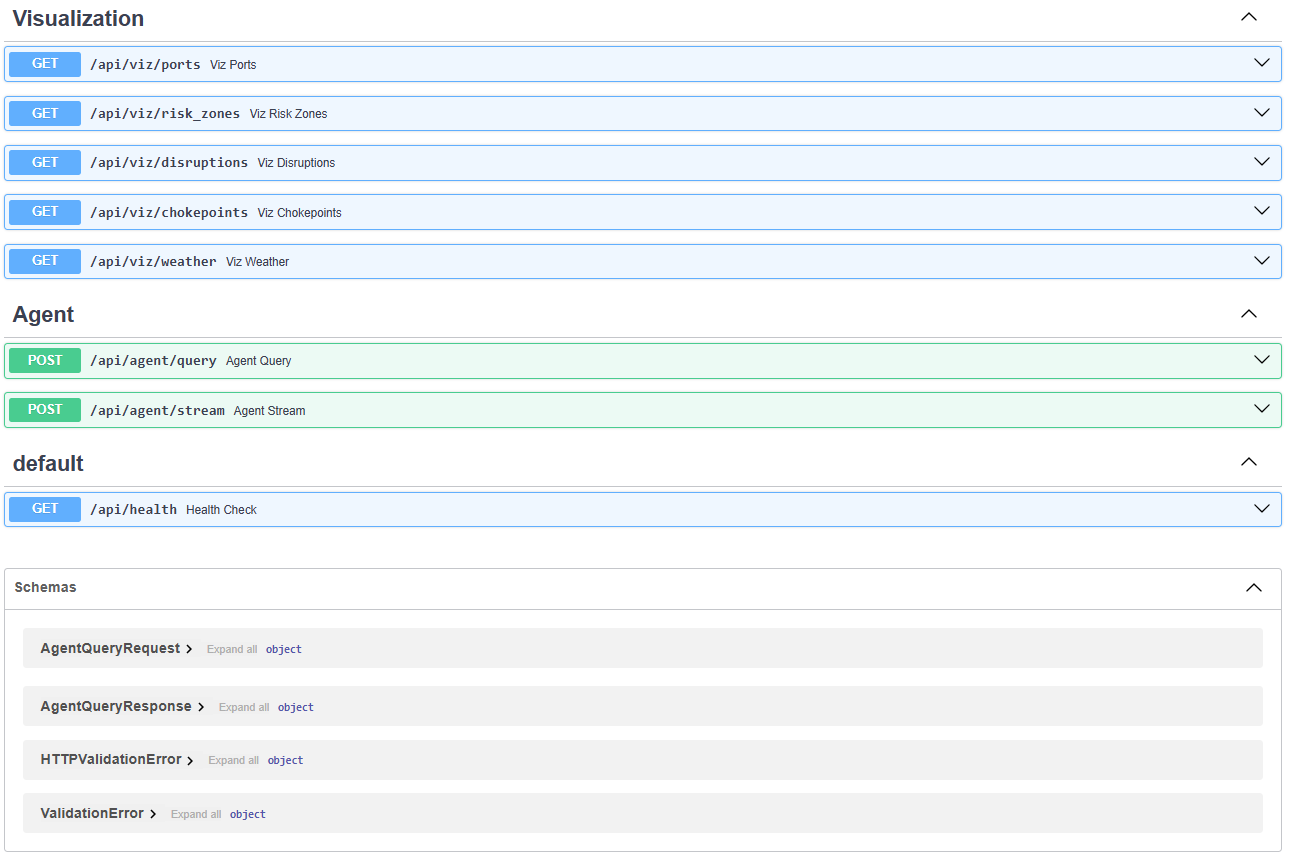
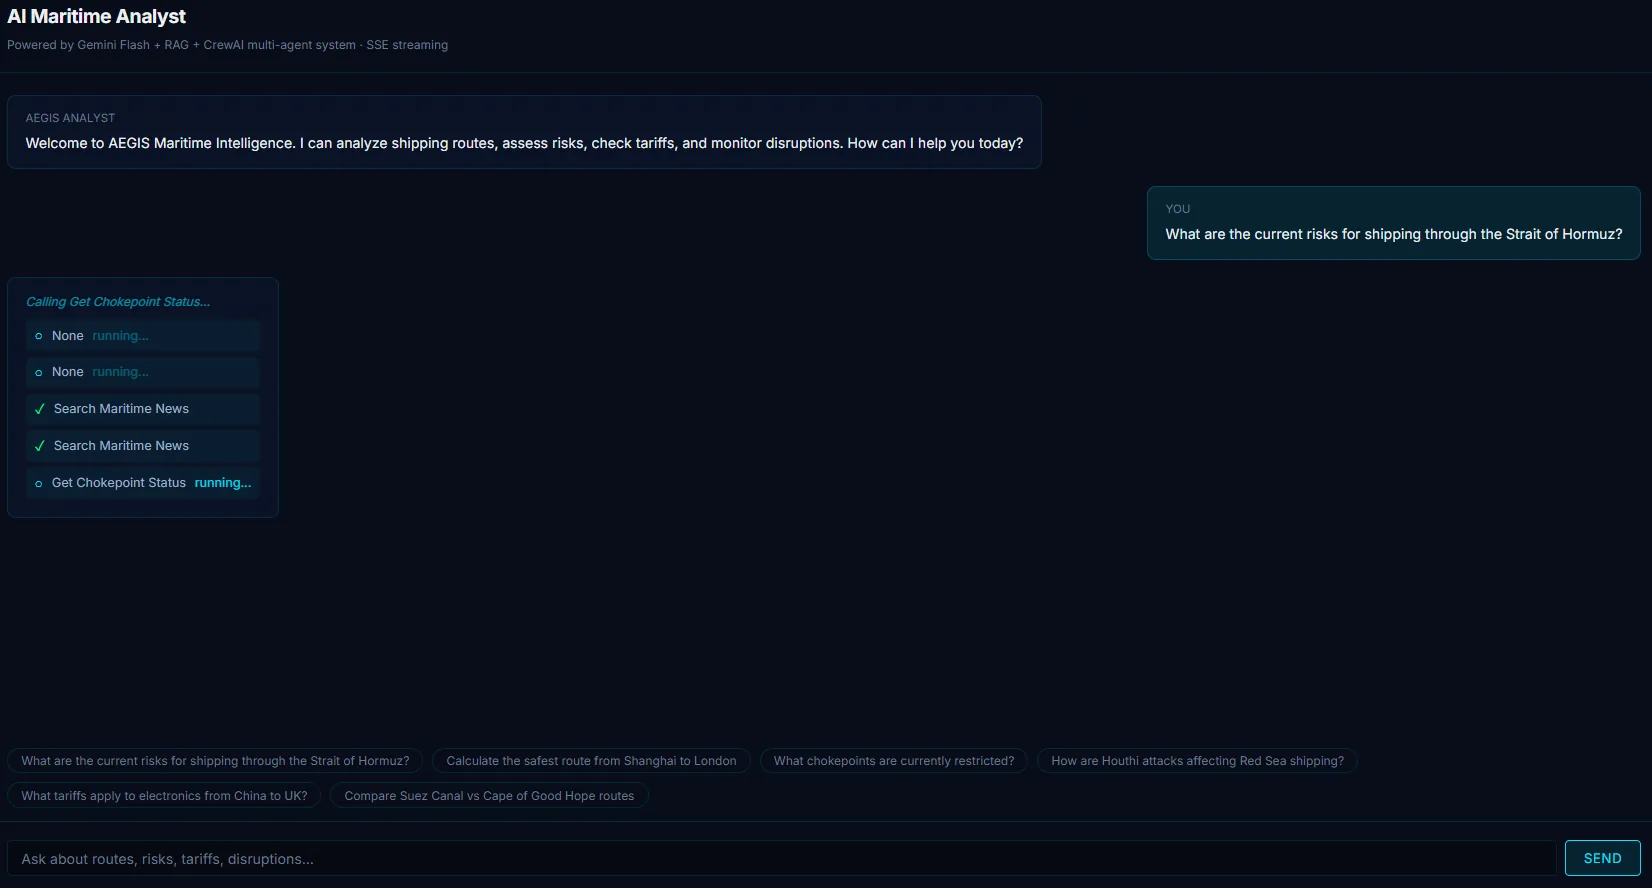
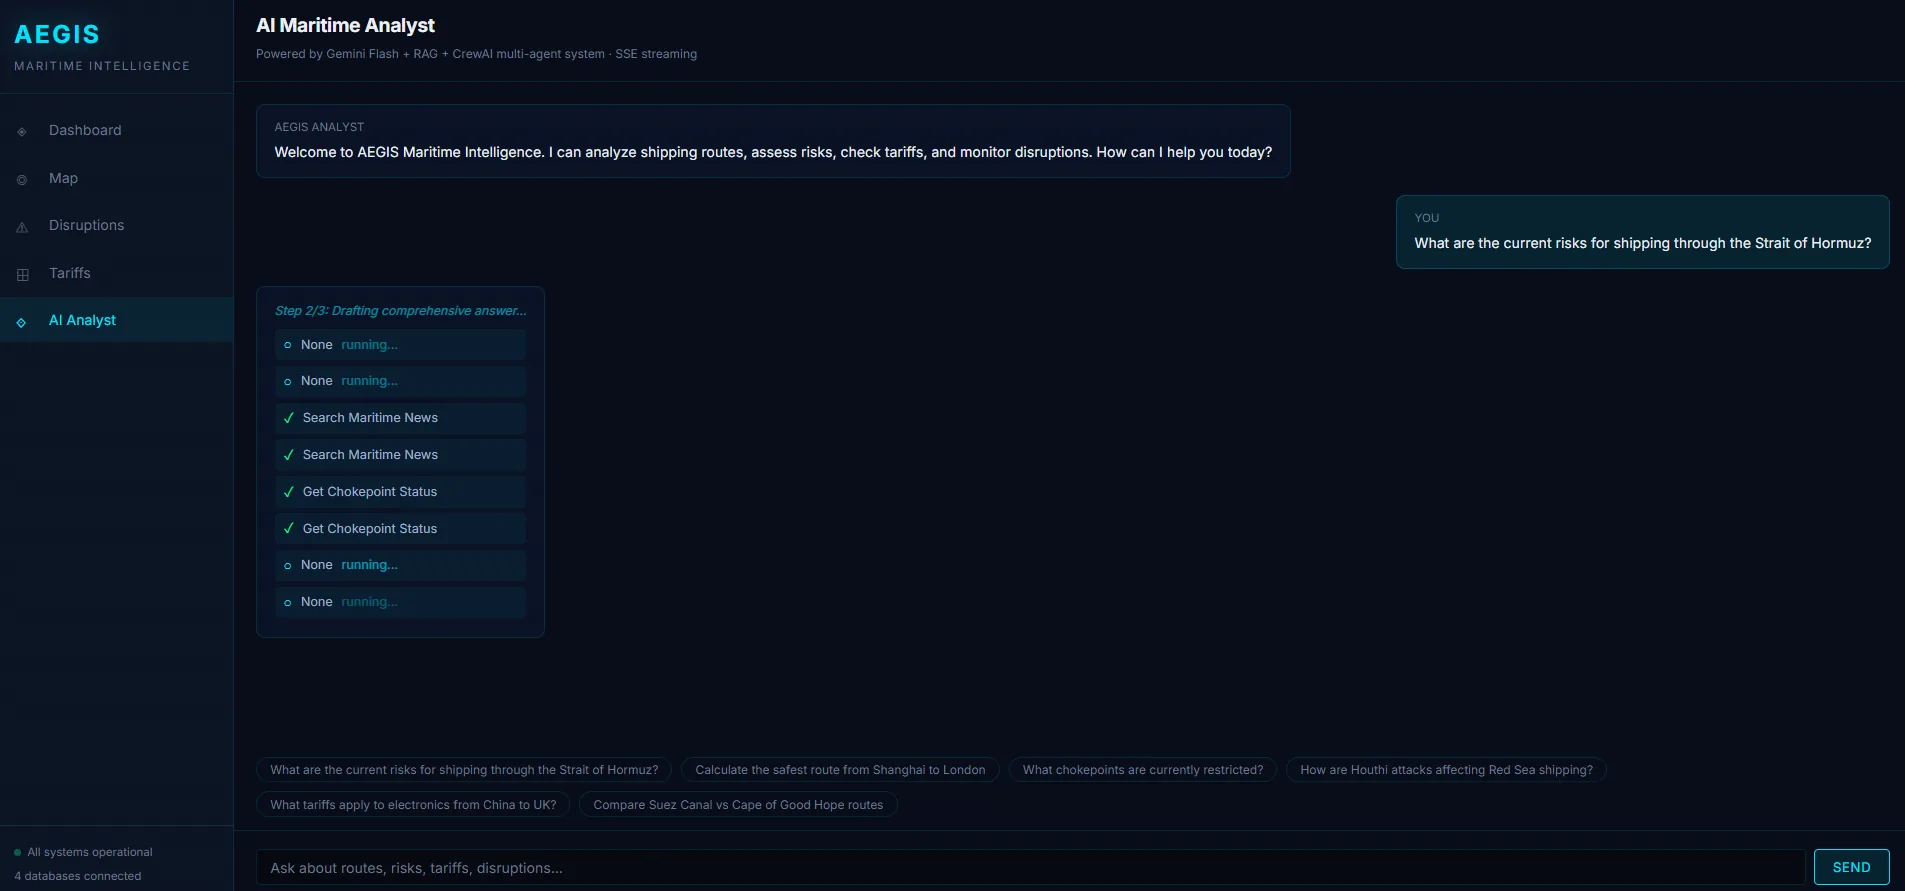
02 / AI analyst.
Natural-language queries route to a CrewAI orchestrator with three specialised agents — risk, routing, compliance. Every intermediate step is captured with W3C PROV lineage; final answers ship with structured citations and a hallucination check pass.
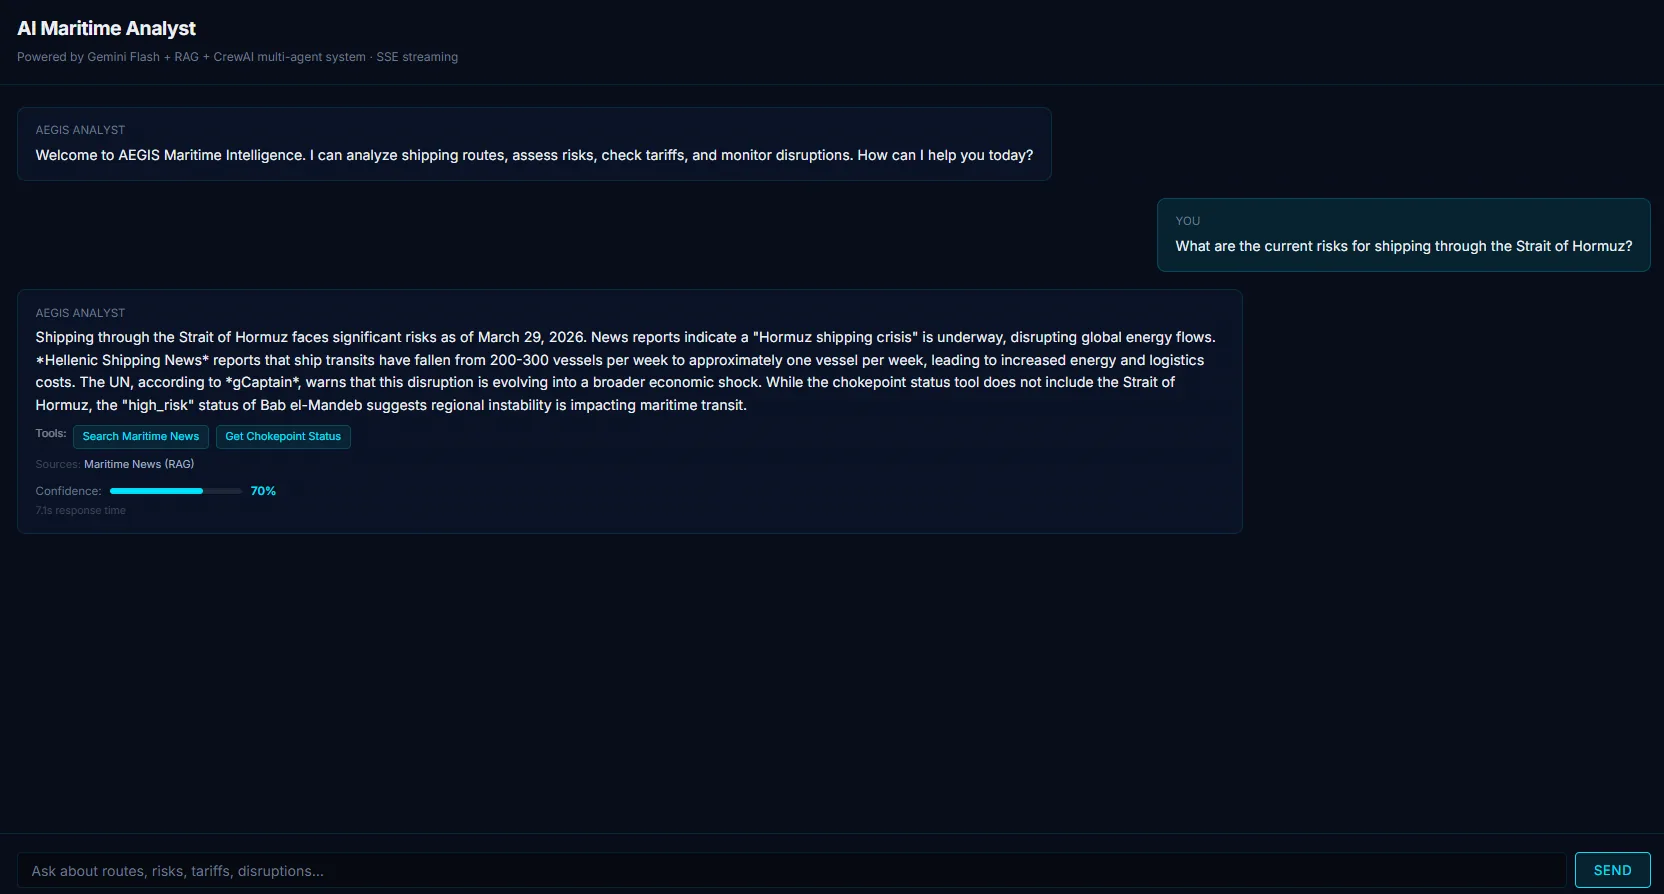
03 / Risk analytics.
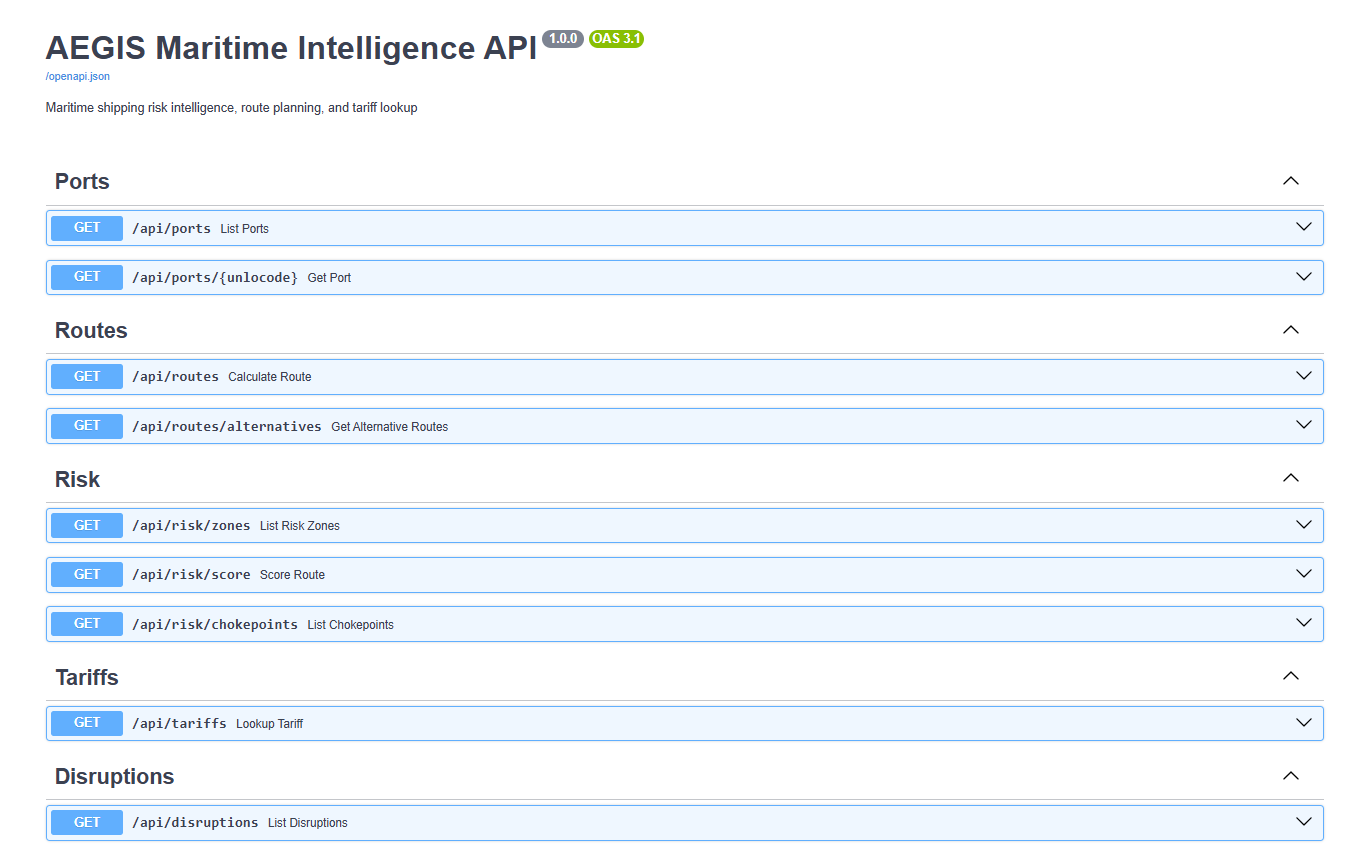
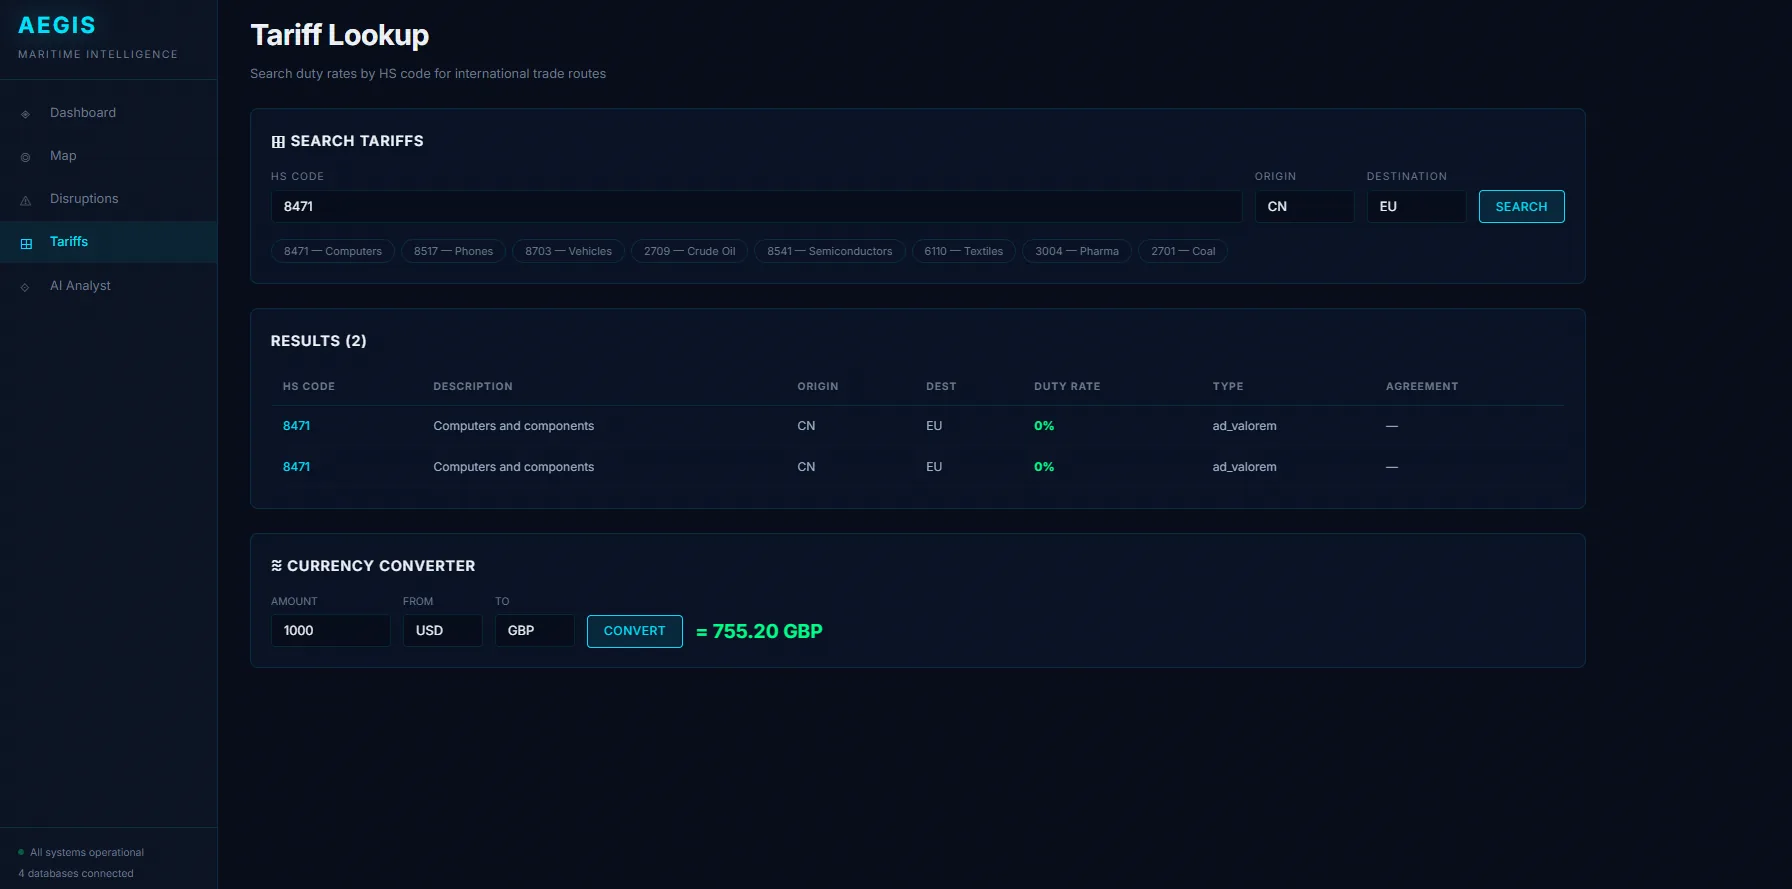
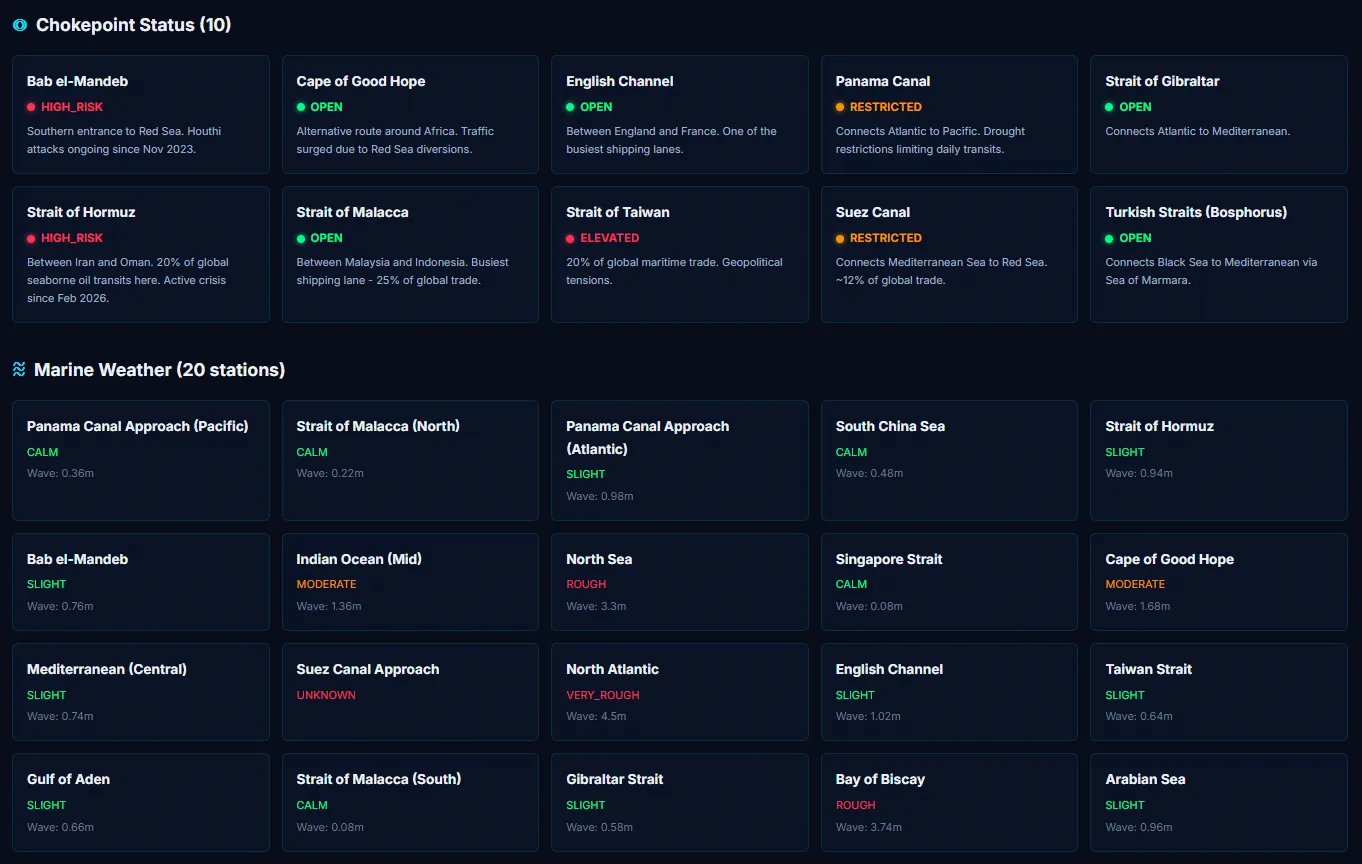
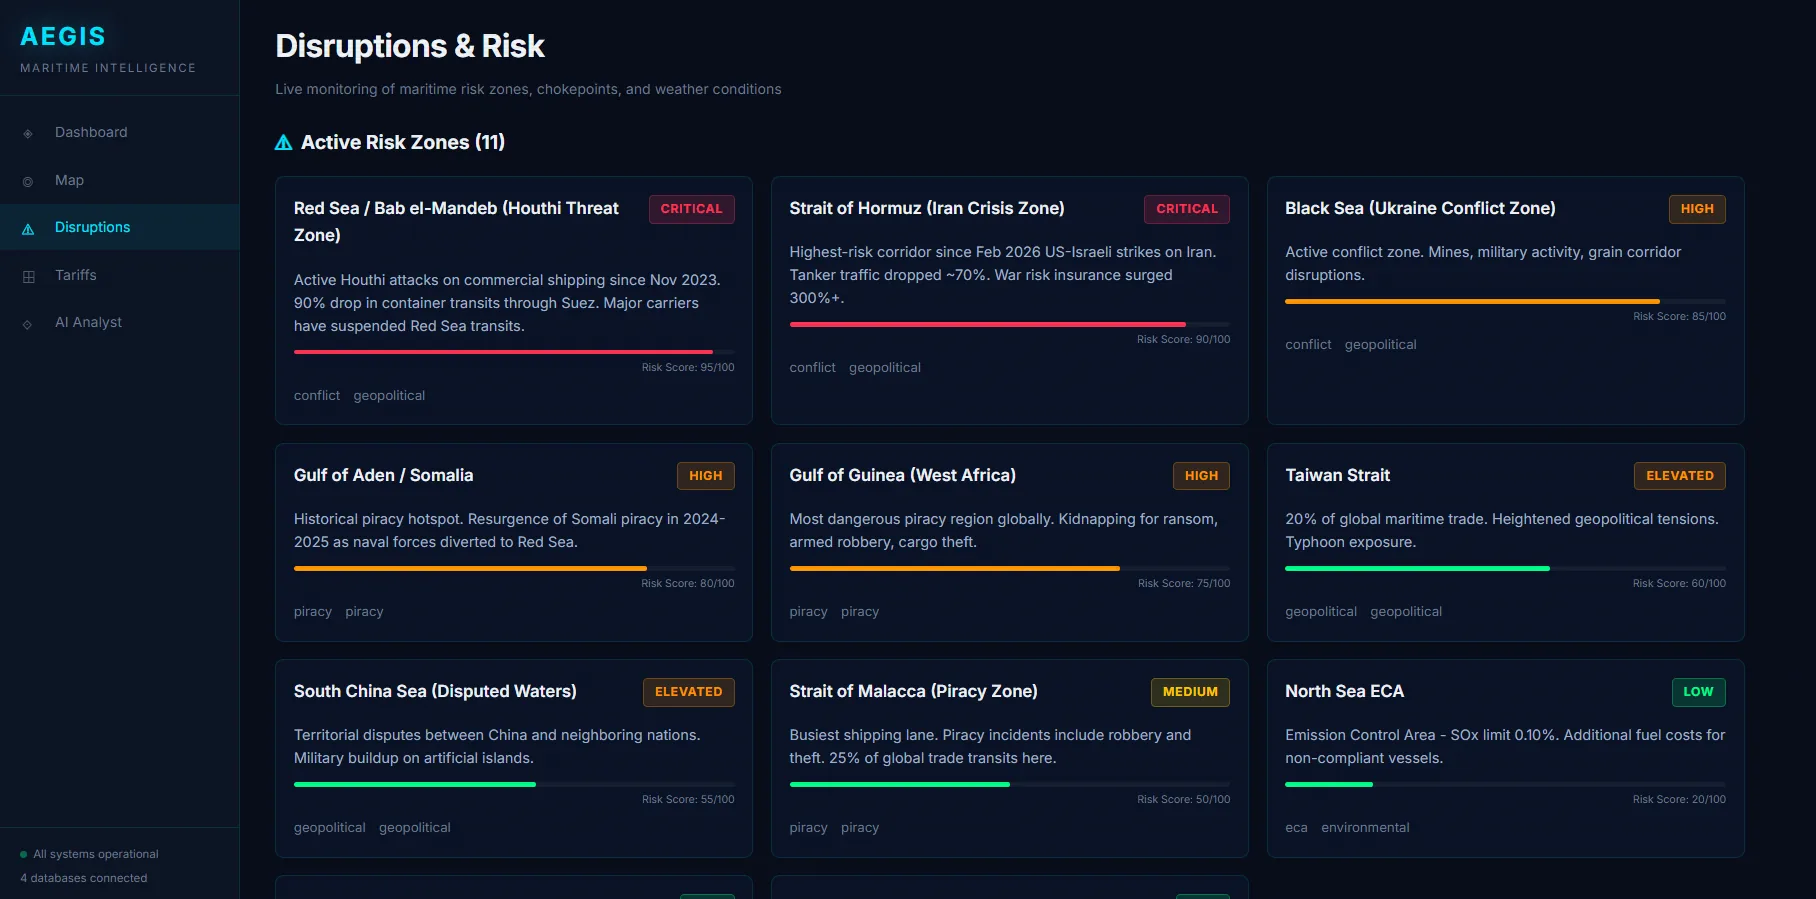
Choke-points (Strait of Hormuz, Suez, Malacca) are weighted by marine weather, active risk zones, and tariff exposure. Each variable is independently queryable, then composed into a single per-vessel risk score.
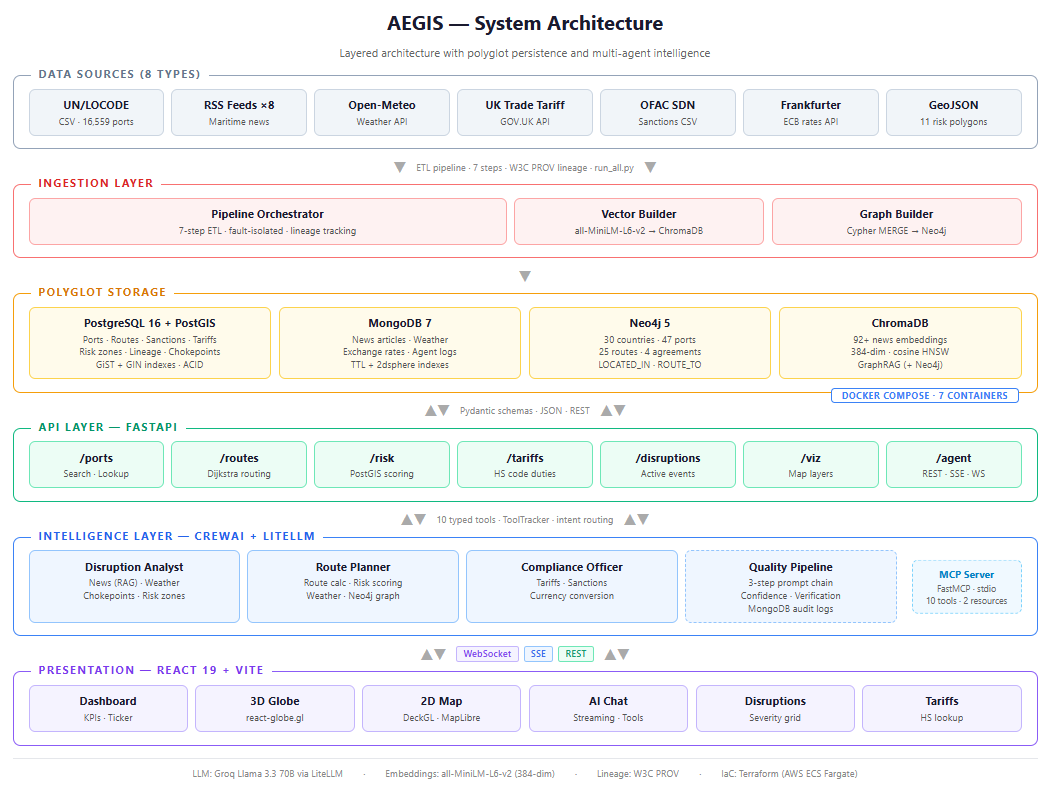
04 / Architecture.
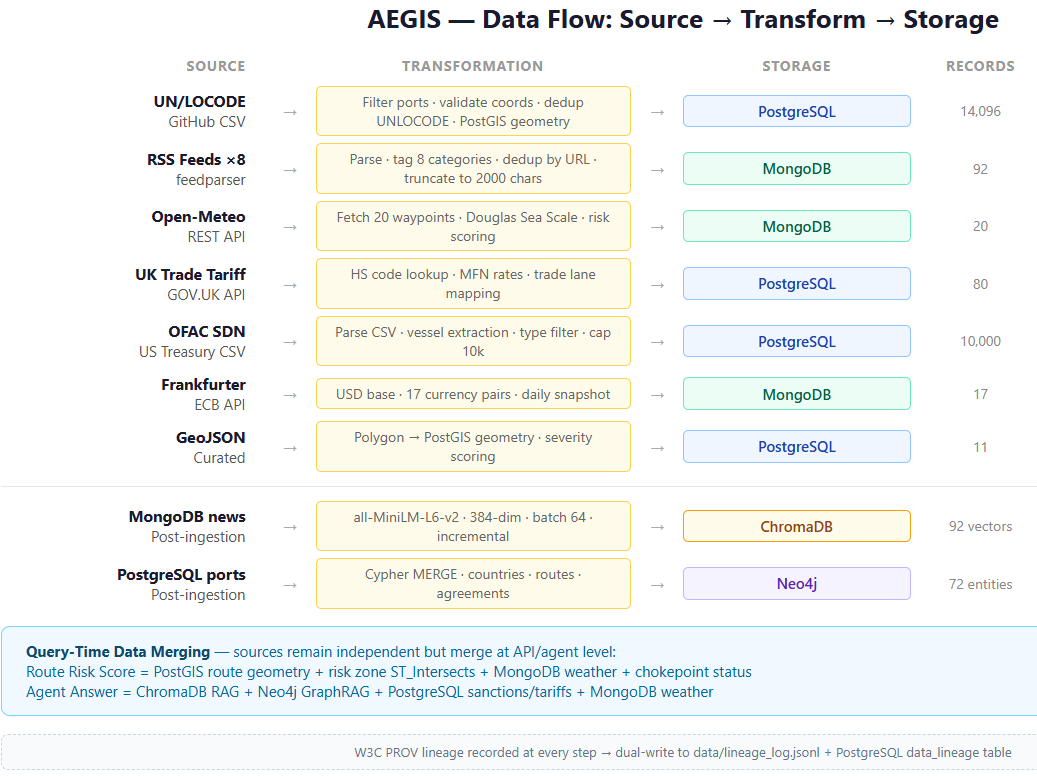
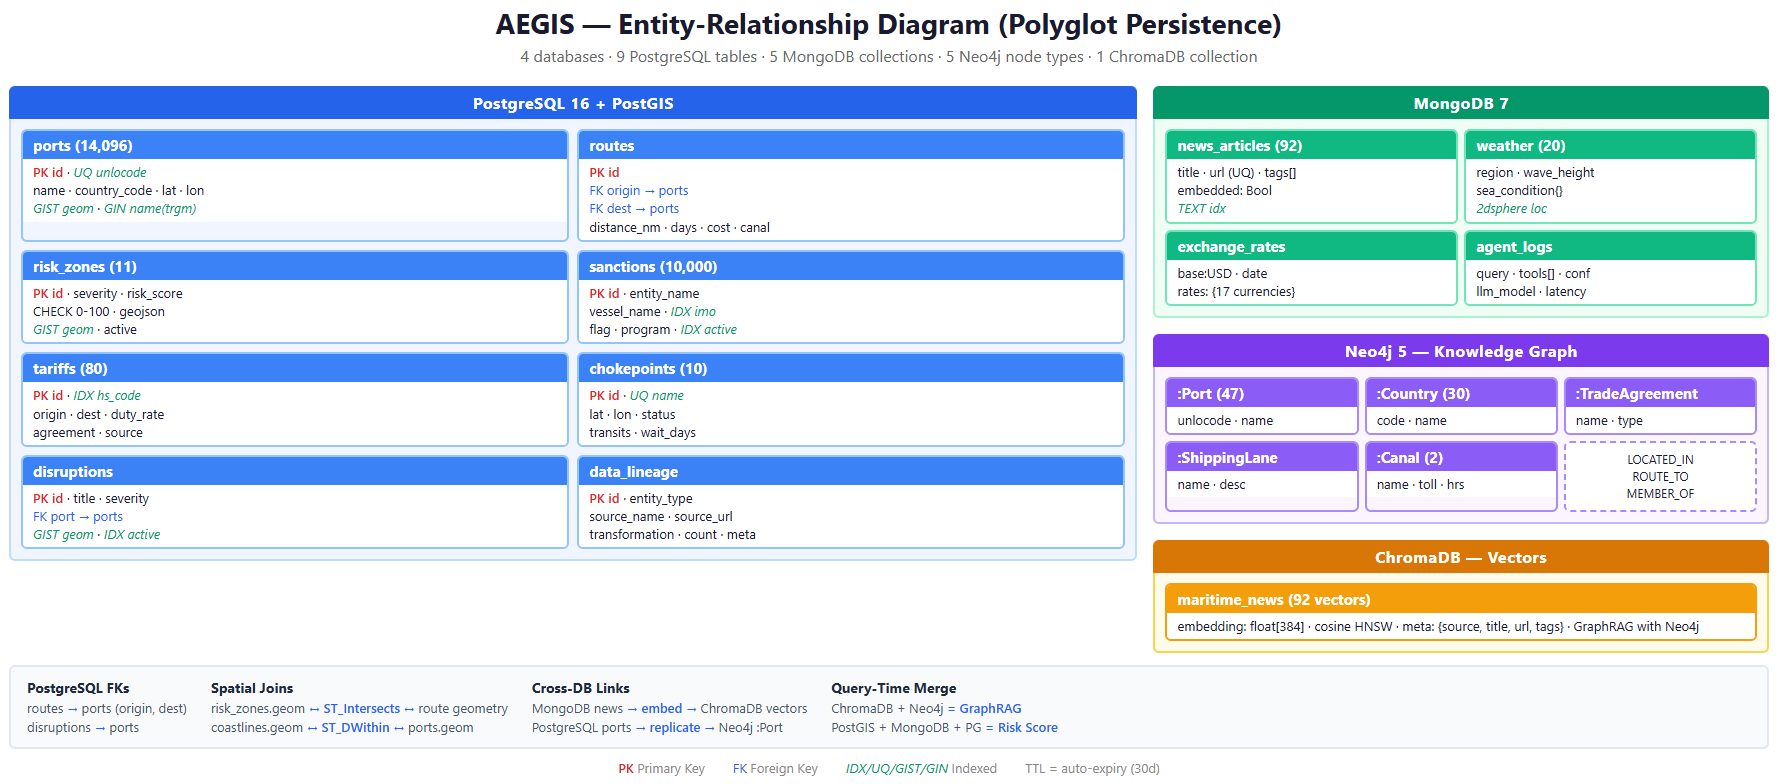
7 ingestion sources land in a Redis cache, then split across PostGIS (vessels & zones), Neo4j (route + supplier graphs), and ChromaDB (vector store for the analyst's RAG layer). FastAPI sits in front; deck.gl renders globe + map; CrewAI runs the agent loop on a separate worker.