London Synergy.
A geospatial intelligence platform that identifies underserved retail locations across Greater London. Tessellating the city into 55,000 H3 hexagons, enriching each with satellite-derived population data, census demographics, and POI density features, and scoring every hexagon for investment potential via a spatially cross-validated XGBoost classifier.
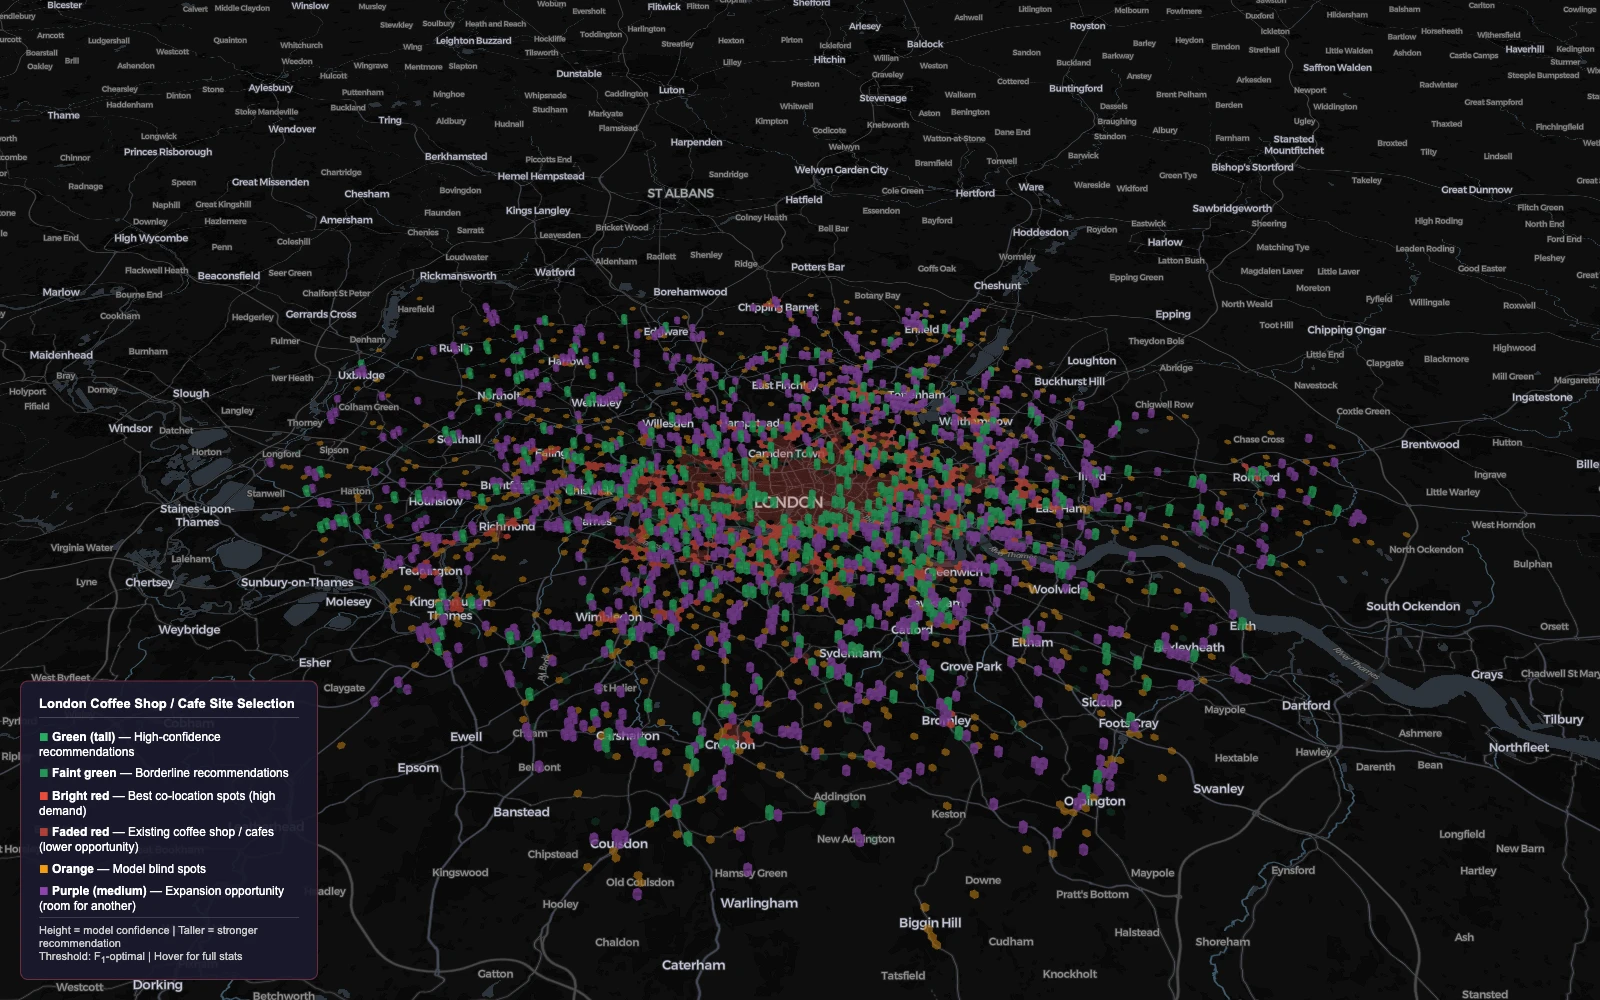
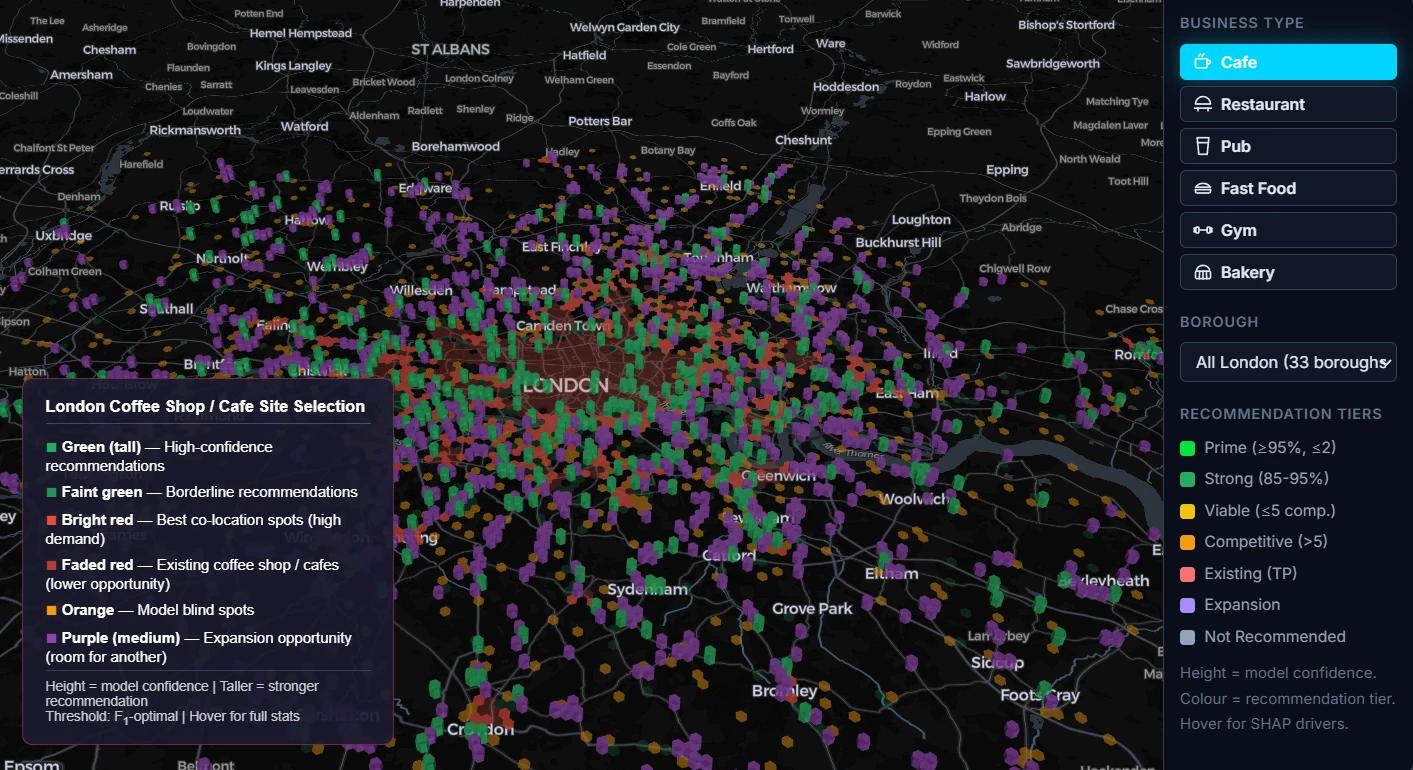
01 / The interface.
The deployed app is a Streamlit dashboard wrapping a Pydeck 3D hex-grid view of London. Each hexagon is colour-encoded by its predicted investment-potential score; users can filter by sector, hover for explanations, and inspect top-ranked sites in detail.
02 / Feature engineering.
Each H3 hexagon at resolution 8 (~0.7 km² per hex) is enriched with features from three independent data sources. The pipeline outputs a unified feature matrix where row = hexagon, columns = ~40 engineered variables.
- 01LandScan rasters → population per hex
Satellite-derived 30-arc-second population grids, reprojected and aggregated to H3 cells. Captures absolute density and rural/urban gradient at sub-LSOA granularity.
- 02ONS Census 2021 → demographic profile per hex
Age distribution, income deciles, employment status, ethnicity, deprivation indices. Joined via LSOA centroid → H3 lookup so each hexagon inherits its containing LSOA's statistics.
- 03OSM POIs → competition + centrality
OpenStreetMap points of interest (retail, leisure, services) extracted by category. Each hex gets a count, a category mix vector, and graph-centrality scores from a NetworkX-built spatial network. The centrality features encode "how reachable is this hex from the rest of the city?"
- 04Burt's Structural Hole metrics
Adapted from network science: a structural hole is a gap between two well-connected clusters that a new node could bridge. Translated to retail siting: hexagons that bridge under-served clusters score higher. This is the project's most distinctive feature.
03 / Why spatial cross-validation.
The single most important methodological choice. Standard k-fold CV would make this model look great — and be useless on new data.
Standard k-fold (wrong)
- Train and test hexagons are randomly mixed.
- Hexagons are spatially autocorrelated — neighbours share population, demographics, POI patterns.
- The model essentially memorises the local neighbourhood and "predicts" the same hex it's already seen variants of.
- Inflated R² / accuracy that won't hold on unseen regions.
Spatial CV (right)
- Test set is a contiguous geographic region held out from training.
- Adjacent hexagons in train and test are forbidden — the model sees the rest of the city, then has to predict an unseen borough.
- Honest performance estimate: how well does this model generalise to a NEW area of London?
- Lower headline numbers, real-world useful.
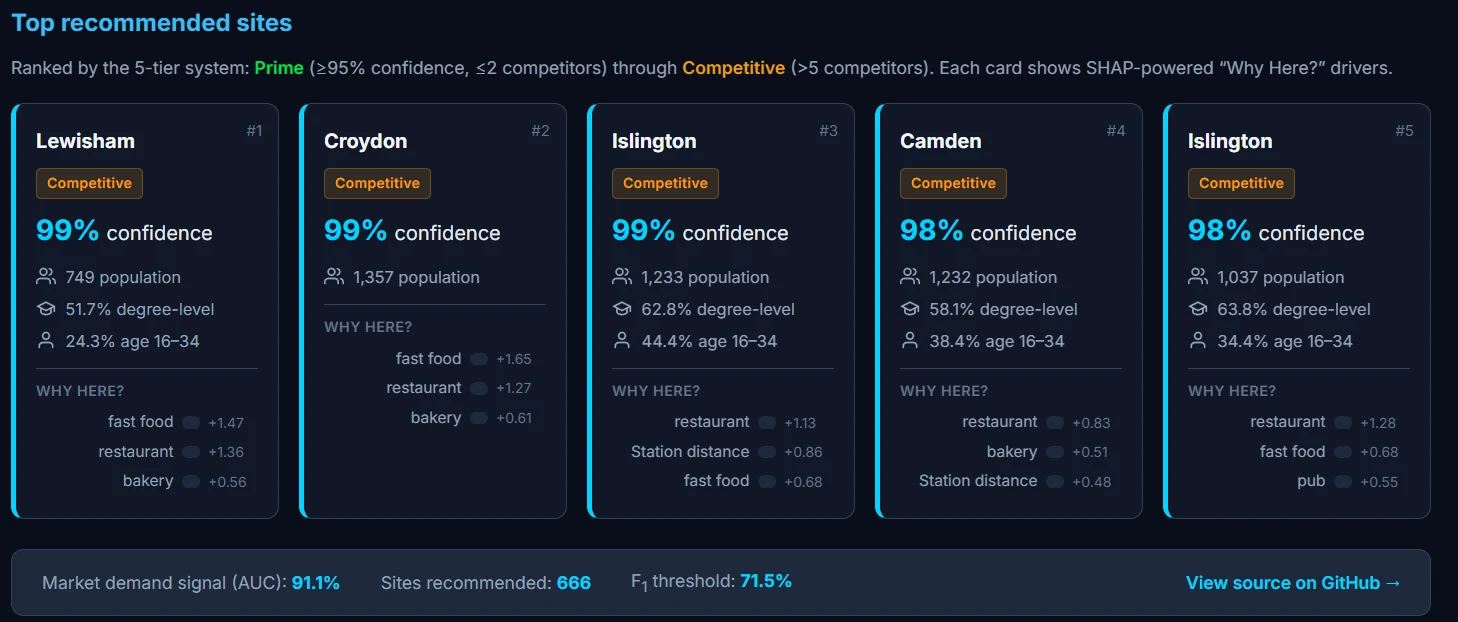
04 / The output.
For any sector or store concept, the model ranks all 55,000 hexagons and surfaces the top candidates with their feature decomposition — which factors drove the score, which neighbouring hexagons are also high-potential, and how confident the prediction is.
Explore it.
The live Streamlit dashboard is deployed at geospatialondon.dathproject.com. Full notebooks, the Optuna search artifacts, and the feature engineering pipeline live in the GitHub repo.