RiskTerrain.
A platform that maps how geopolitical disruptions cascade through S&P 500 supply chains. Live events from USGS + NewsAPI go through a 6-node LangGraph pipeline that traverses a 154-company knowledge graph in SurrealDB and emits a per-company exposure score in under 8 seconds.
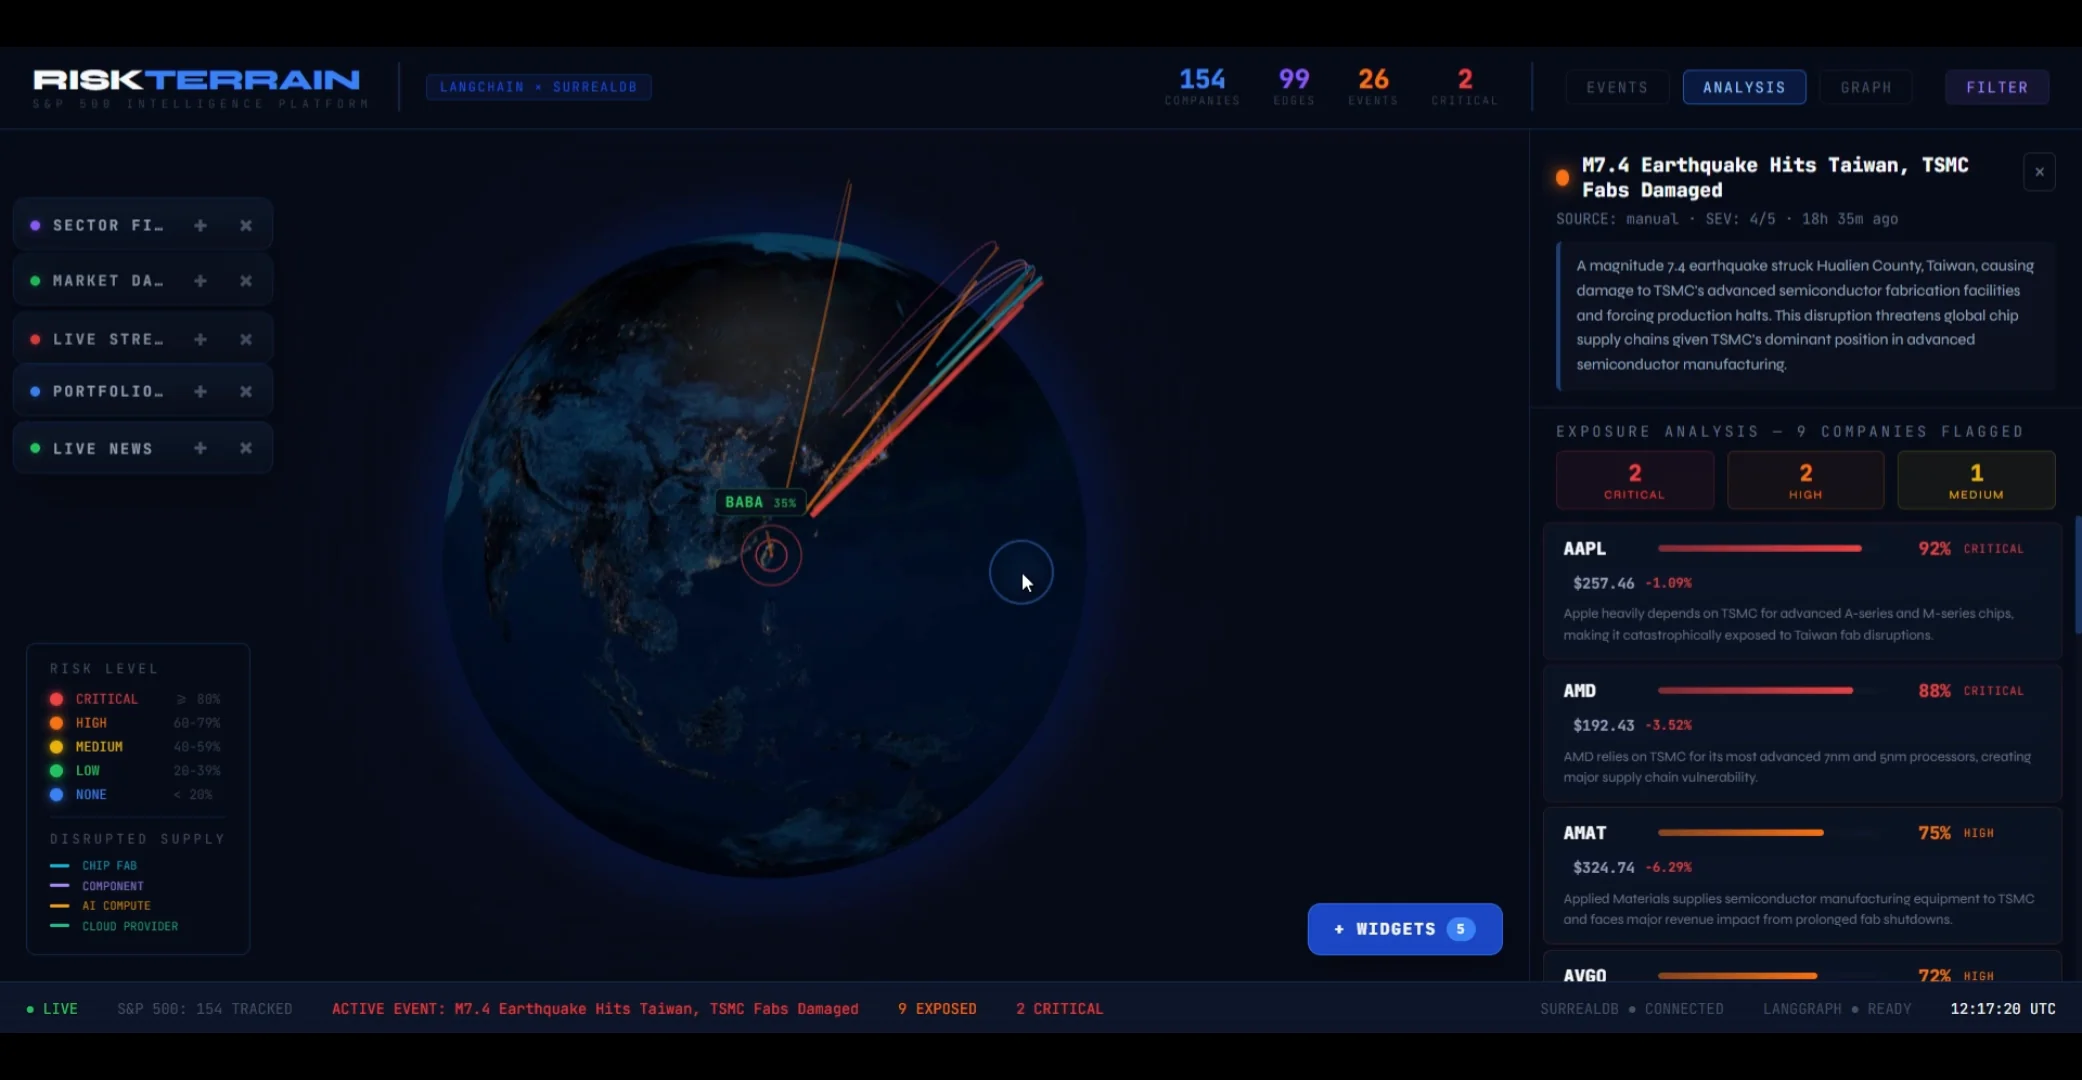
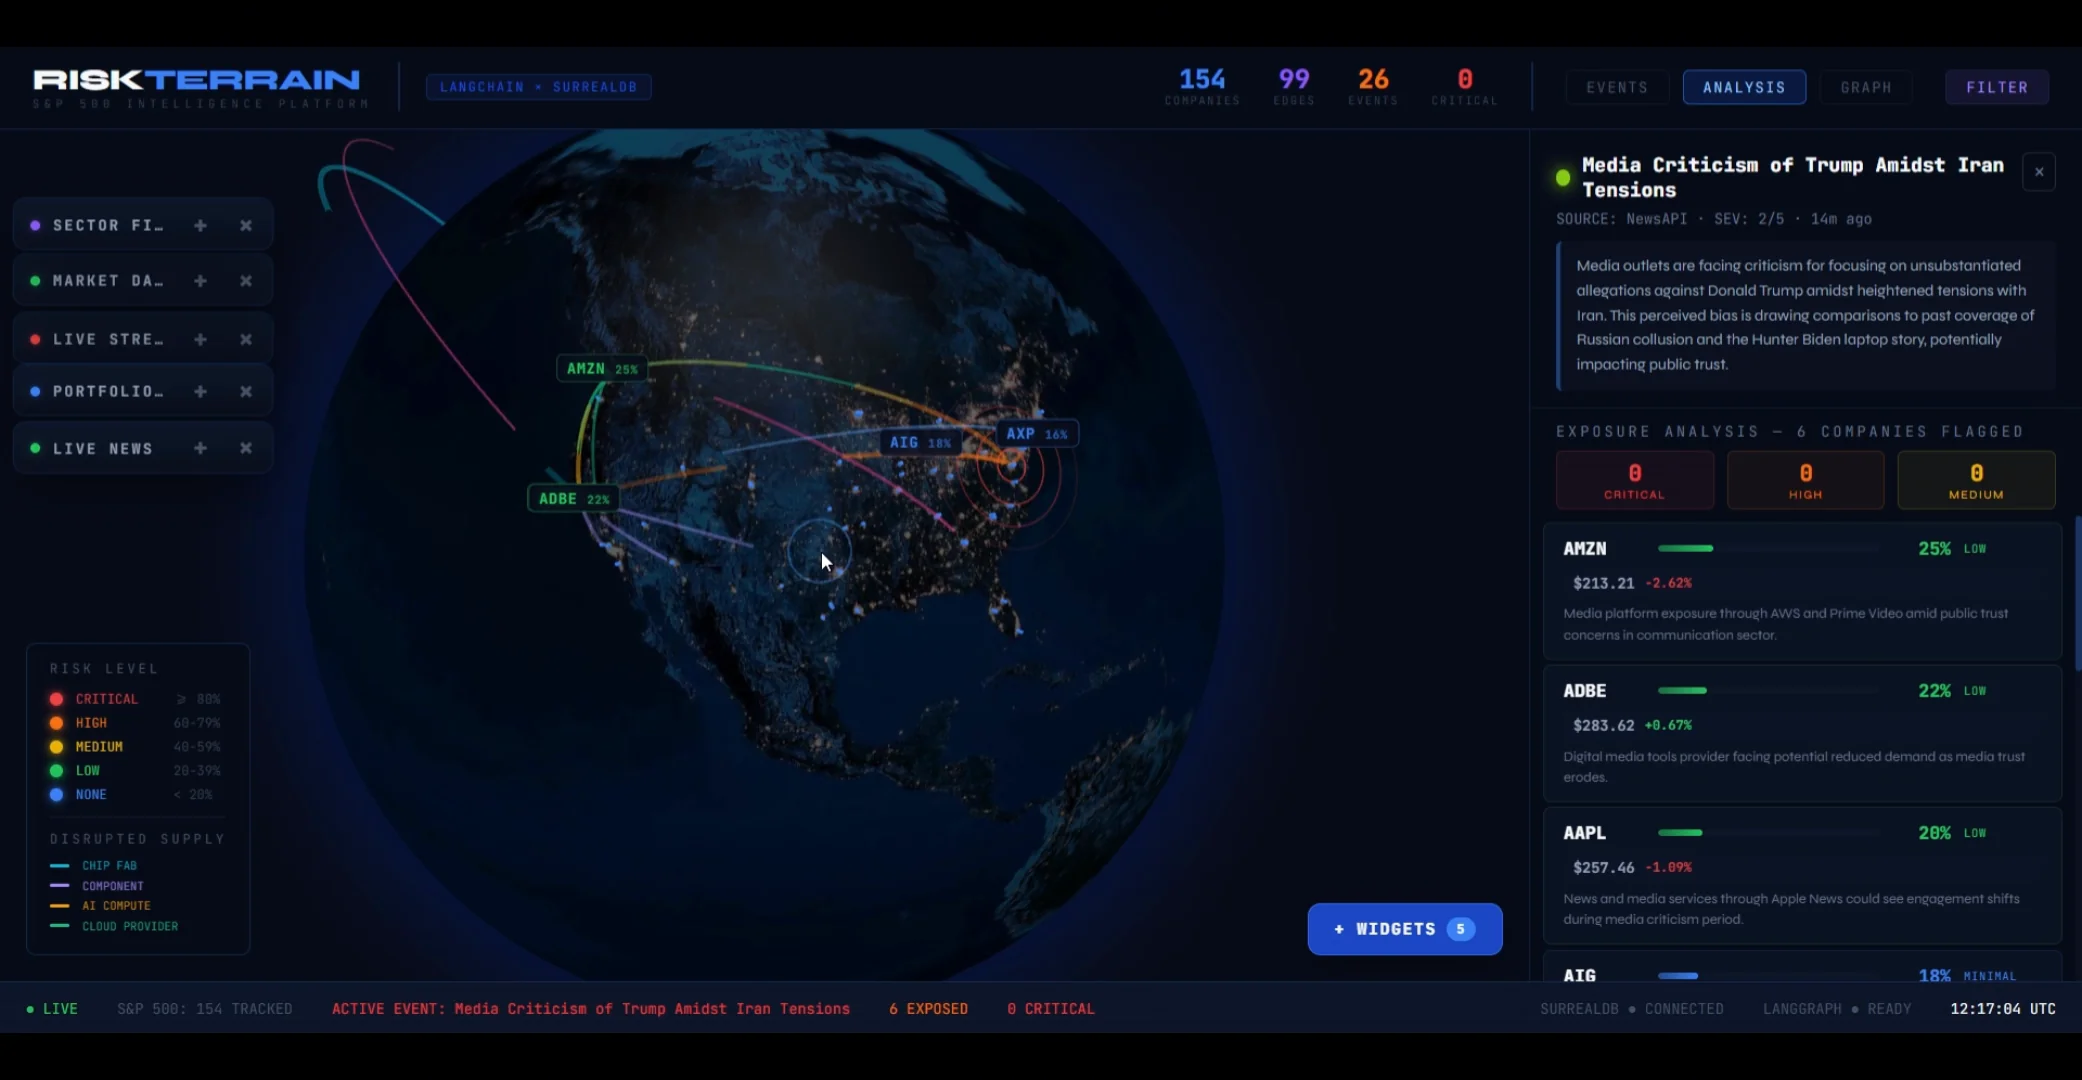
01 / Live view.
The dashboard shows the system mid-cascade — a M7.4 earthquake hit Taiwan, the TSMC supply chain lit up, and within seconds the platform identified the S&P 500 companies most exposed (AAPL: 92% critical, AMD: 88% critical) with per-row natural-language reasoning.
02 / The pipeline.
Six nodes, one direction. Each step is independently testable; the whole graph runs in batch (for backtesting) or streaming (for live events). The latency budget is dominated by the graph traversal — everything else is cheap.
- 01Event ingestion
Poll USGS earthquakes (60s) and NewsAPI (15min). Each raw event becomes a normalised record:
{ type, severity, region, timestamp, source }. - 02Classification
An LLM classifier assigns a category (natural disaster · political instability · trade dispute · cyber) plus a severity score (1-5). Cheap model — this is a fast filter, not a deep analysis.
- 03Entity extraction
NER pulls company names, regions, sectors, and commodities from the event text. The output is a set of candidate entities to feed the graph step.
- 04Graph traversal
Multi-hop traversal in SurrealDB. Start from affected entities, walk supplier / customer / competitor edges out to 2-3 hops, collect exposed companies. This is the load-bearing step — the value is here.
- 05Risk scoring
Per company: weight by graph distance, edge strength, region overlap, and event severity. Fuse into a single 0-100 exposure score. Calibrated against historical event-impact pairs.
- 06Output
Ranked companies + per-row "why" trace (which edge chain caused exposure). Surfaces in the Three.js 3D terrain frontend.
03 / Hybrid retrieval.
Pure graph traversal misses thematic risk — an event about "rare earth export controls" only catches downstream companies if their edges are tagged correctly. Pure vector search misses structural risk — semantic similarity doesn't encode "who supplies whom." So the system runs both and unions the results.
Graph queries
- Multi-hop traversal in SurrealDB across supplier, customer, competitor relations.
- Region-aware: edges carry geographic metadata, so "Taiwan earthquake" → semiconductor supply chain on the right continent.
- Returns structural exposure with provenance — which edge chain caused which company to surface.
Vector queries
- sentence-transformer embeddings on company business descriptions.
- Event text is embedded and cosine-similarity-searched against the company corpus.
- Catches thematic risk the graph misses (an event about lithium prices flags battery-related companies the supply graph never explicitly connected).
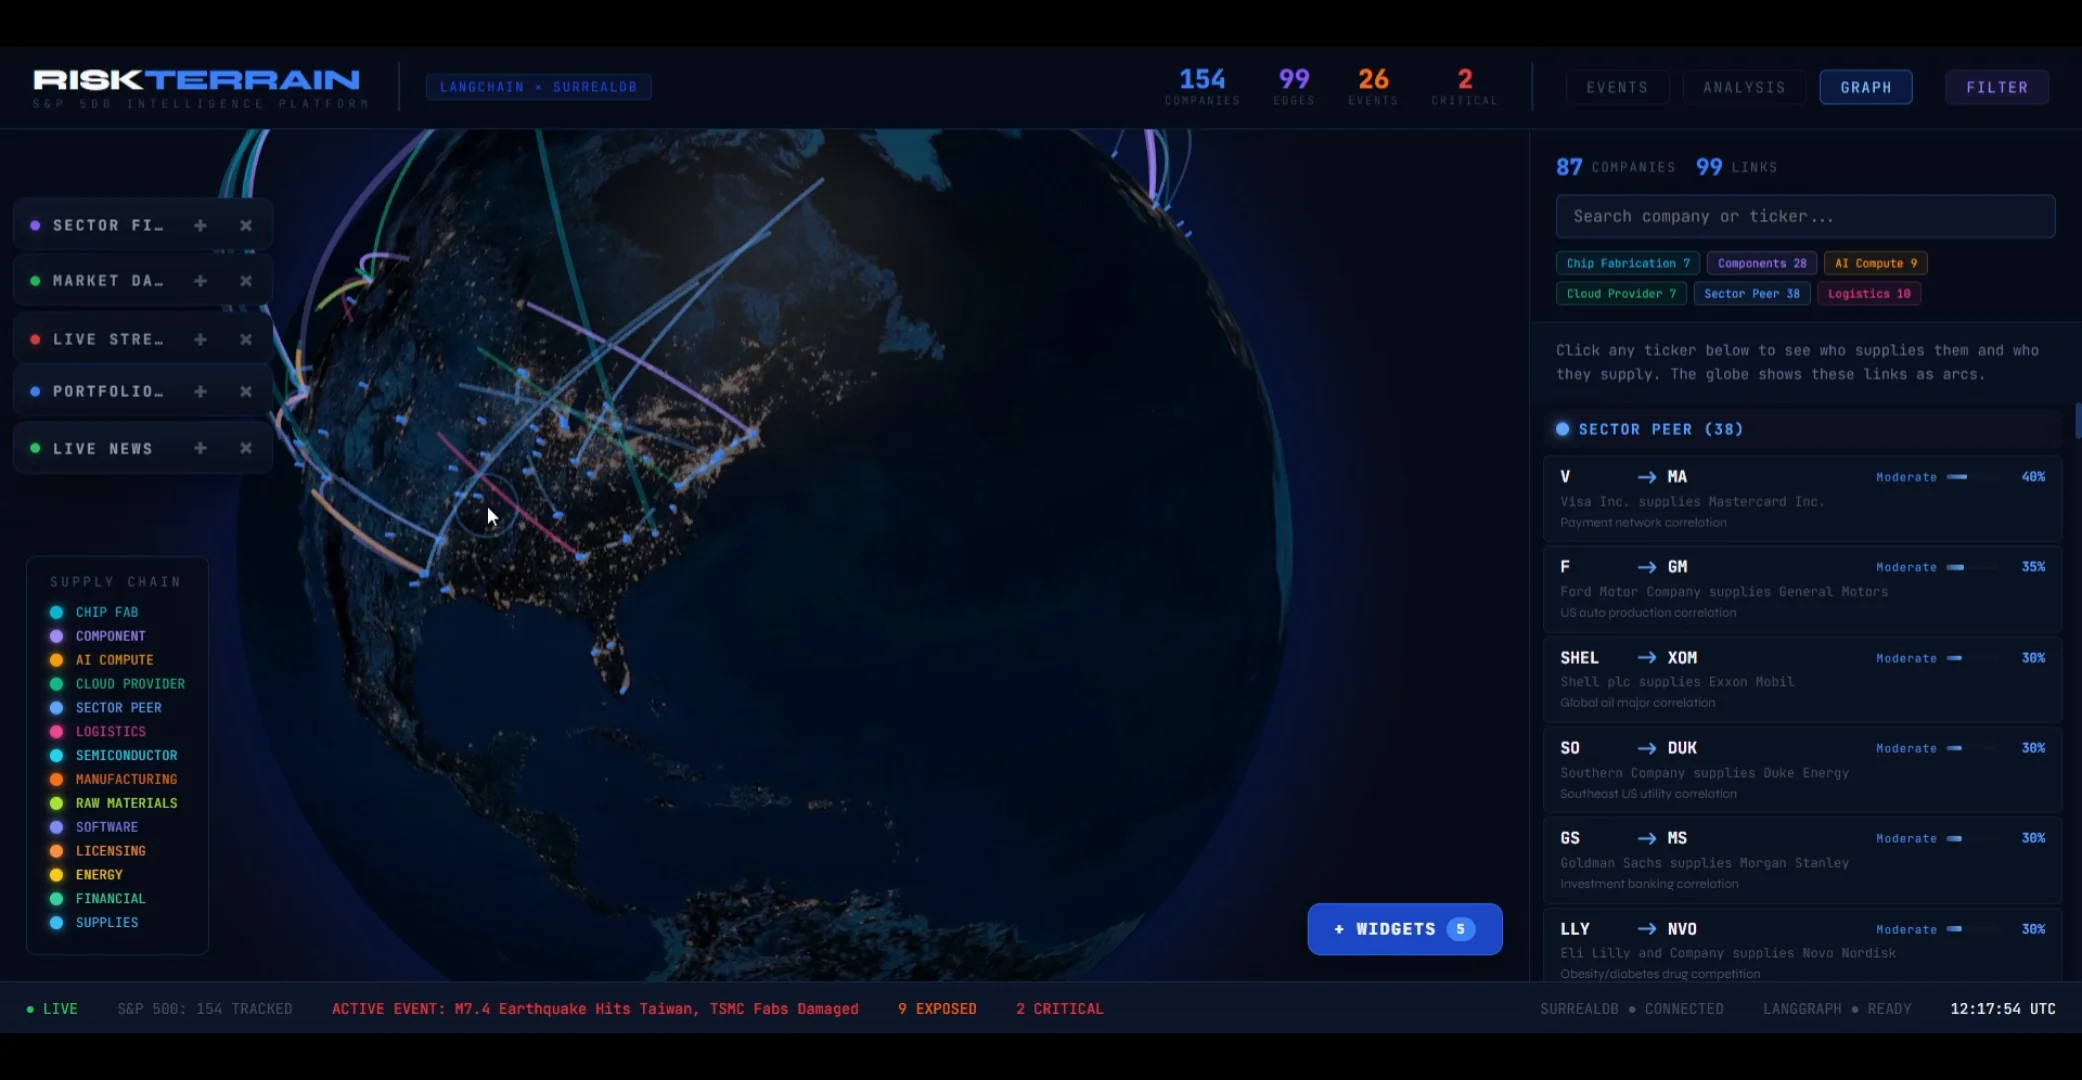
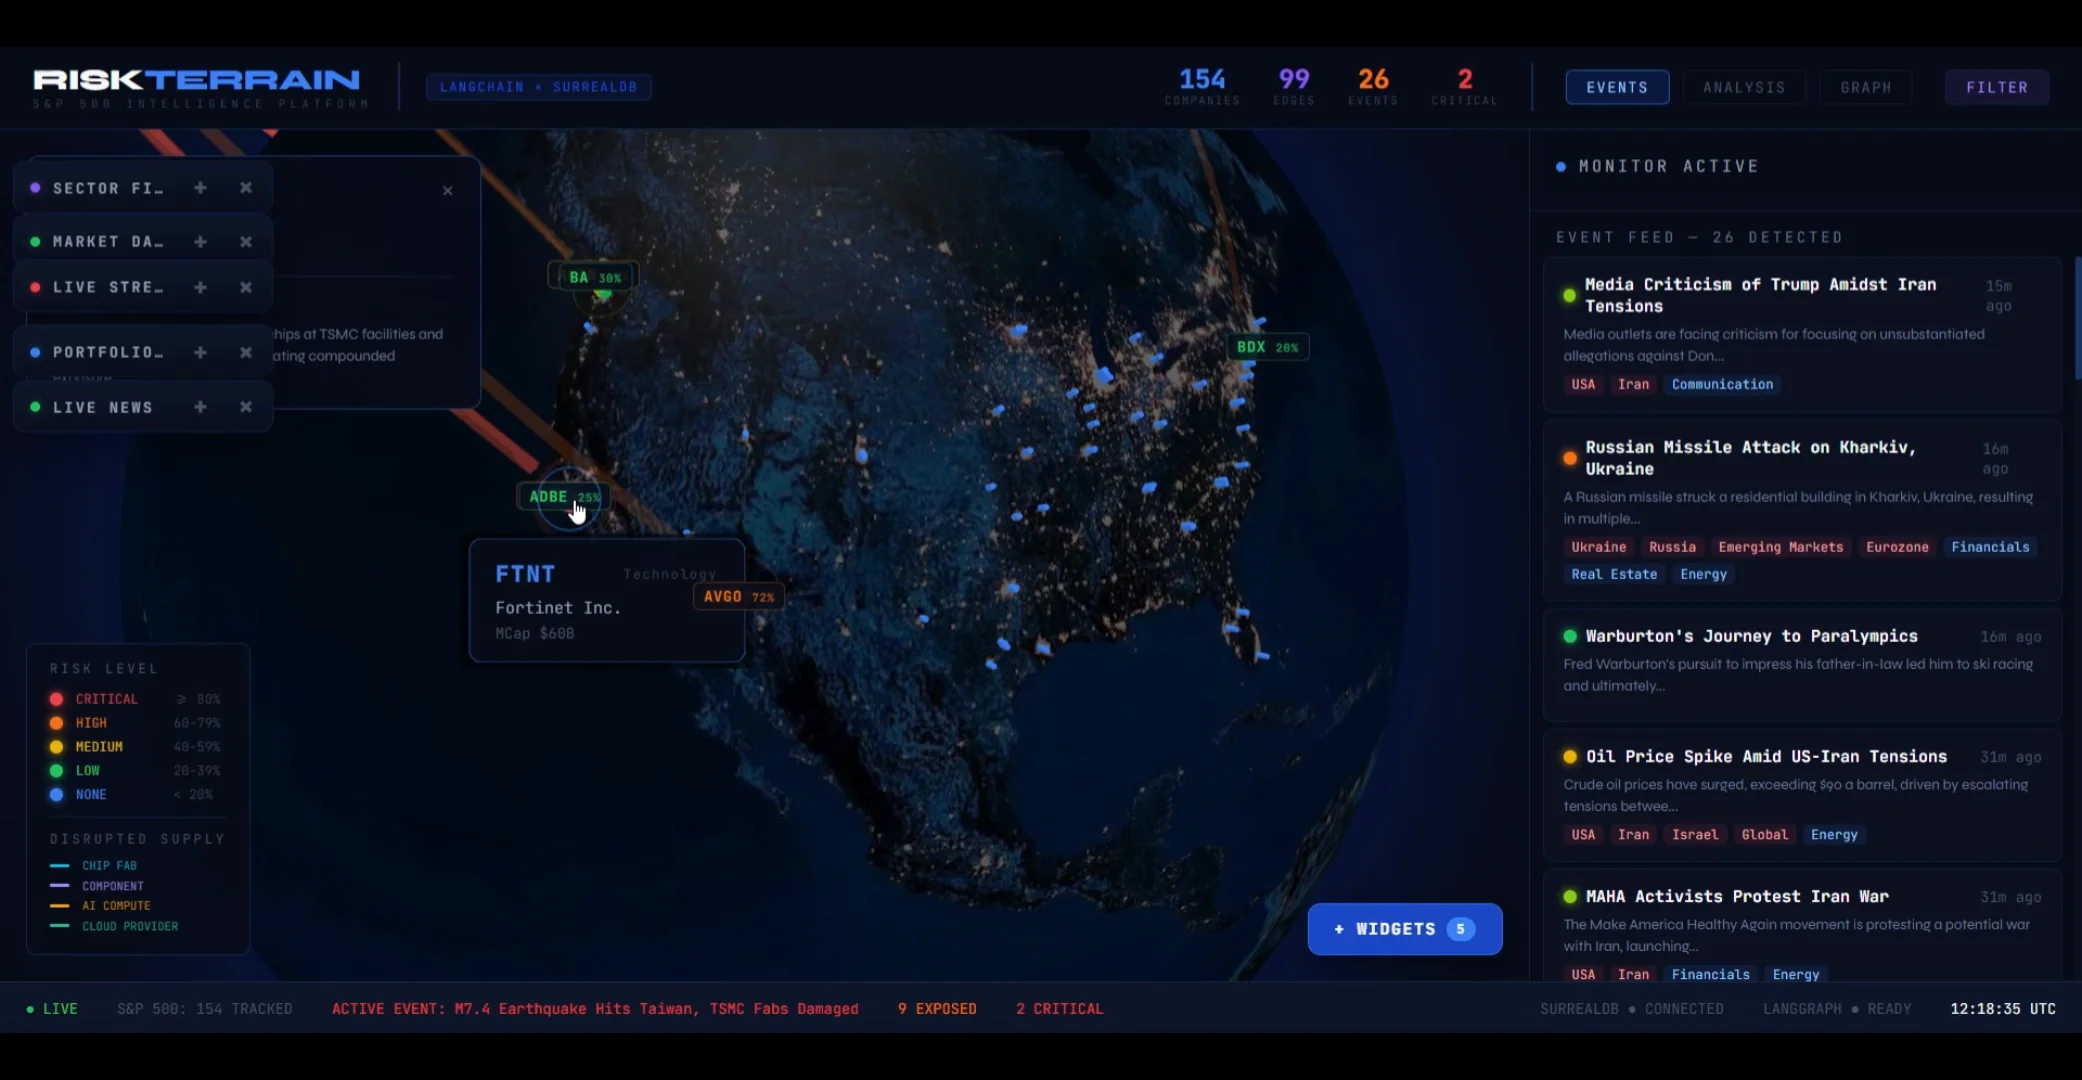
04 / Graph & events.
Beyond the per-event drill-down, two other views let users browse the underlying data. The graph view exposes the supply-chain network directly; the events feed shows every shock the system has detected, with classification + tags.
05 / Why SurrealDB.
The graph could have lived in Neo4j (more mature) or in PostgreSQL with recursive CTEs (no extra dependency). SurrealDB won three trade-offs.
Graph + document + relational in one engine. The event log is a document store; the supply network is a graph; the company metadata is relational. One DB, three shapes.
Graph traversal syntax (->supplier->company) maps directly to the mental model. Neo4j's Cypher is more powerful but verbose; SurrealQL keeps the pipeline code legible.
Native vector indexing means the hybrid retrieval doesn't need a separate vector DB. One container instead of two — important for a hackathon submission.
See it.
Source on GitHub. Built for the SurrealDB + LangChain hackathon — sub-8-second risk scoring across 154 S&P 500 companies from the moment an event lands.